CHAPTER 25
Statistics: The Maths That Proves An Edge
Only statistics can tell you whether you are profitable or merely lucky. These are the numbers that tell you when to stop and when to scale.
25.1Expectancy
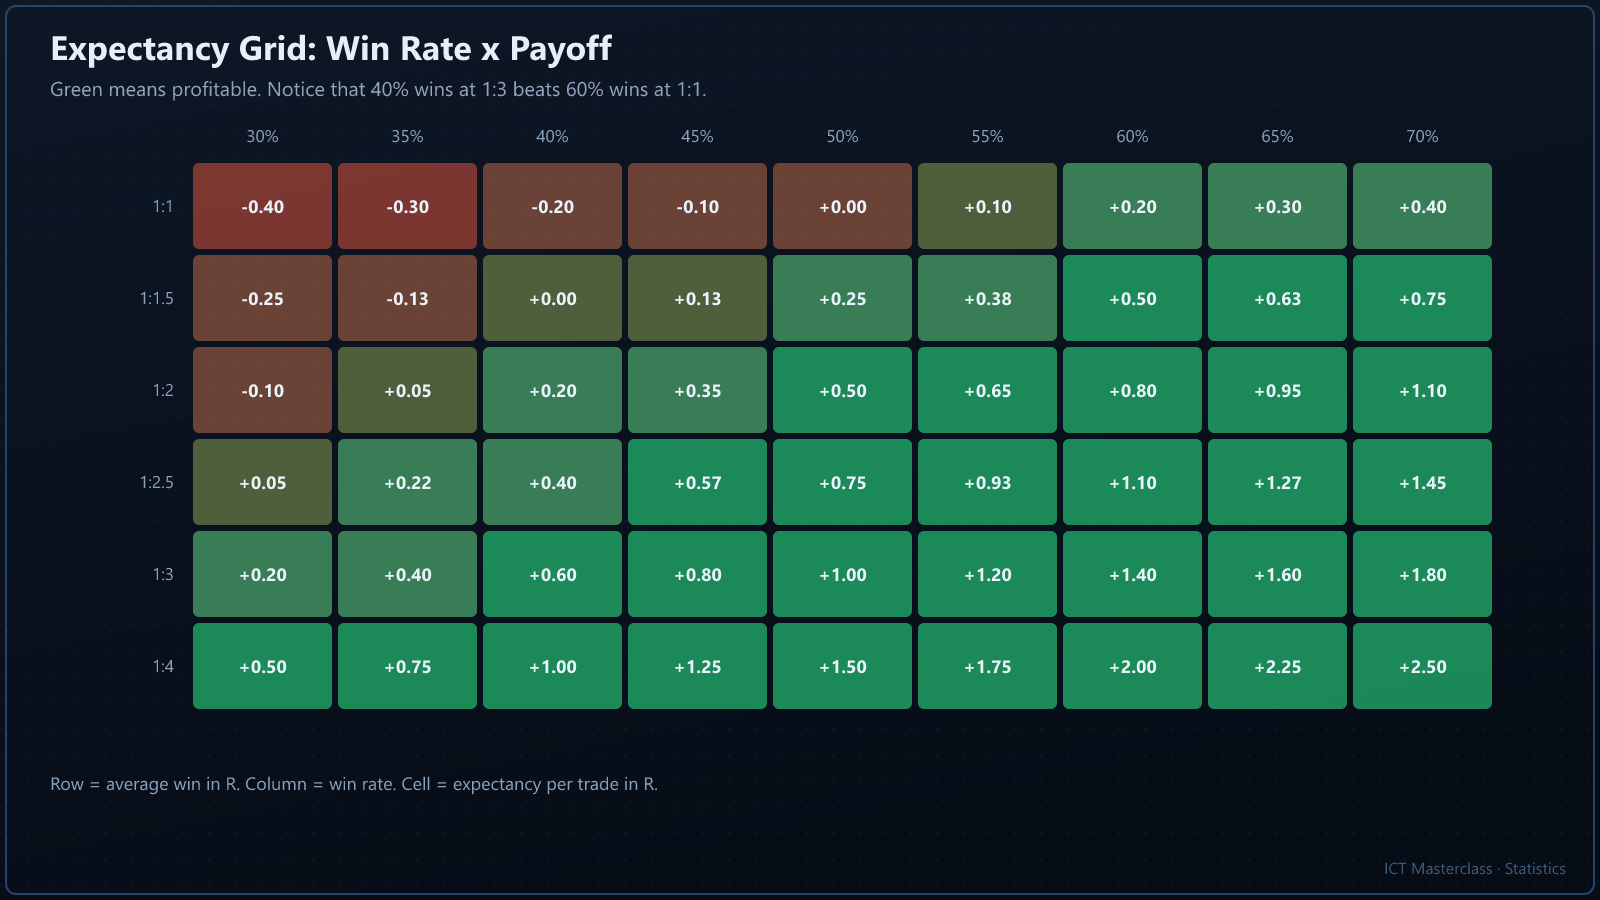
Expectancy = (win% x average win) - (loss% x average loss). Example: 45 percent wins, average win 2.5R, average loss 1R gives (0.45 x 2.5) - (0.55 x 1) = +0.57R per trade.
| Metric | Formula | Good value |
|---|---|---|
Expectancy | (W x AvgW) - (L x AvgL) | Above +0.2R |
Profit factor | Gross profit divided by gross loss | 1.5+ |
Average R | Total R divided by trades | +0.2 |
Break-even win rate | 1 divided by (1 + payoff) | 33 percent at 1:2 |
| Payoff | Break-even win rate | Your actual win rate |
|---|---|---|
1:1 | 50% | Profitable above 55 percent |
1:1.5 | 40% | Comfortable above 45 percent |
1:2 | 33% | Excellent above 40 percent |
1:3 | 25% | Outstanding above 35 percent |
1:4 | 20% | Rare above 30 percent |
25.2Results Are A Distribution
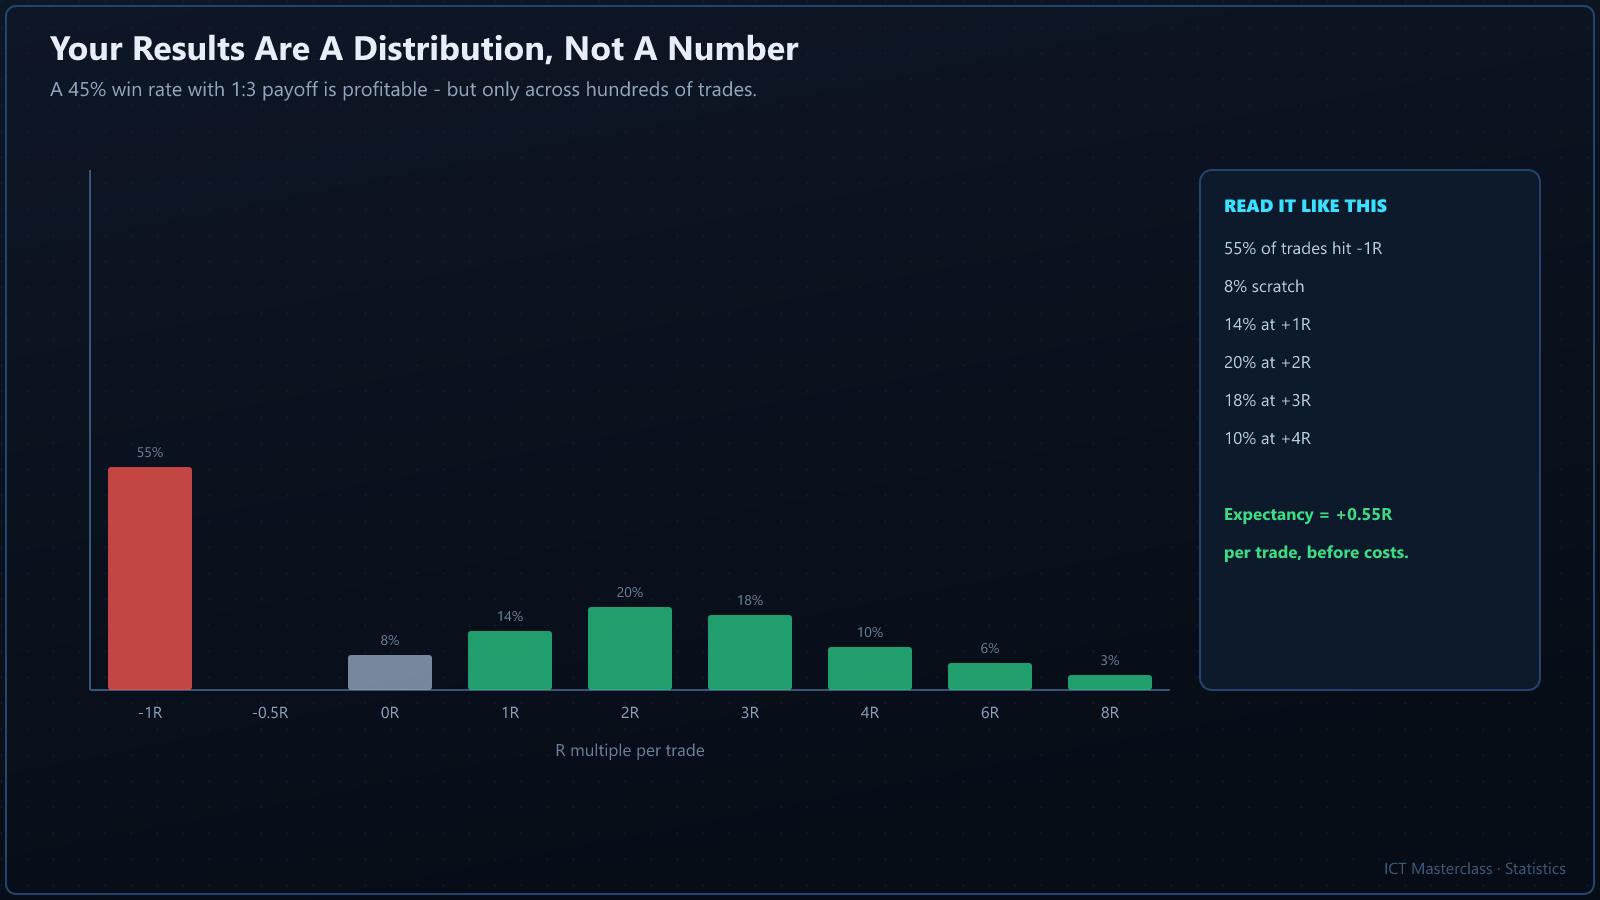
Notice: most trades lose 1R and the profit comes from a few big winners. That is why you can be profitable even after three losses - and why patience is maths, not emotion.
25.3How Many Trades You Need
| Sample | Standard error (50% win) | Decision |
|---|---|---|
20 | ±11% | It tells you nothing |
50 | ±7% | A first hint |
100 | ±5% | Direction is visible |
300 | ±3% | Trustworthy |
1,000 | ±1.6% | Edge established |
25.4Risk Of Ruin
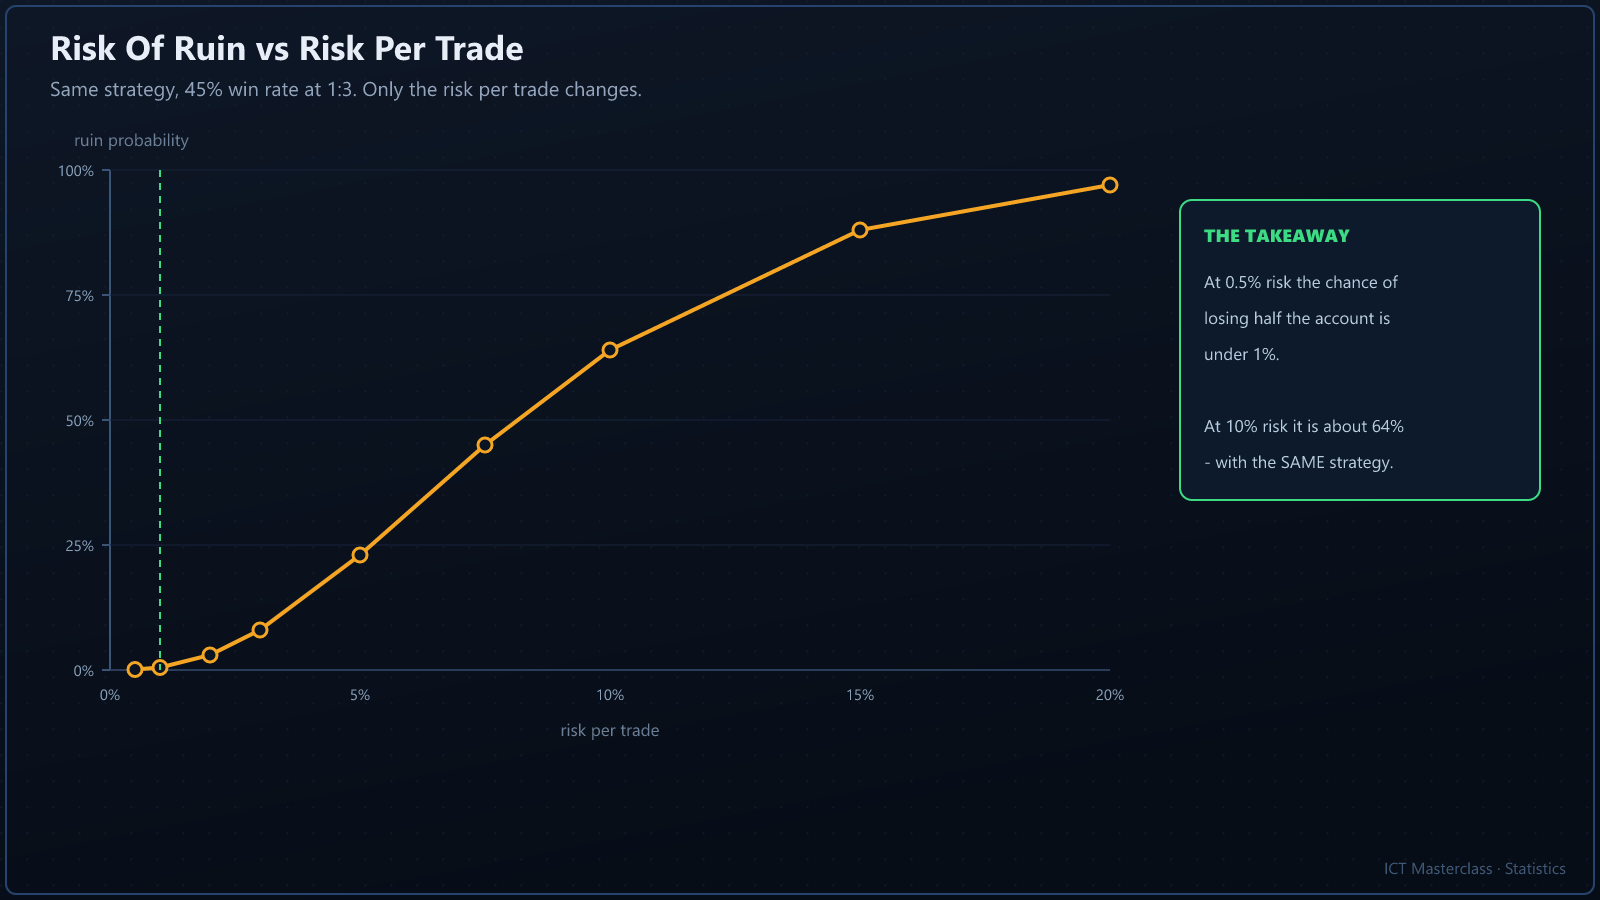
Same strategy, 45 percent wins at 1:3. At 0.5 percent risk the chance of losing half the account is under 1 percent; at 10 percent it is 64 percent. Risk is your biggest controllable variable.
25.5Monte Carlo And Walk-Forward
- Shuffle your 100 R values a thousand times to see the worst realistic drawdown.
- If the simulation shows a 20 percent drawdown, be ready for it in reality.
- Walk-forward: test on six months, validate on the next two with unchanged rules.
- A backtest without out-of-sample data is decoration.
25.6Statistical Traps
| Trap | What happens |
|---|---|
Curve fitting | Tweaking rules until the backtest looks good - useless live |
Survivorship | Only saving screenshots of winners |
Cherry picking | Showing the best month as the year |
Small sample | Deciding on ten trades |
Outliers | One 10R trade distorts everything |
"Luck can give you a good month. Without statistics you cannot tell which was which."
Educational material only · not financial advice.