CHAPTER 16
Candles, Patterns and 20 Examples
A candle is the alphabet of the market. First the candles you actually use, then candlestick patterns, then forty complete examples across two bases - each with its own chart.
16.1The Ten Most Used Candles
ICT does not care about the name of a candle, only its shape and location. These ten candles carry almost all the information on a chart.
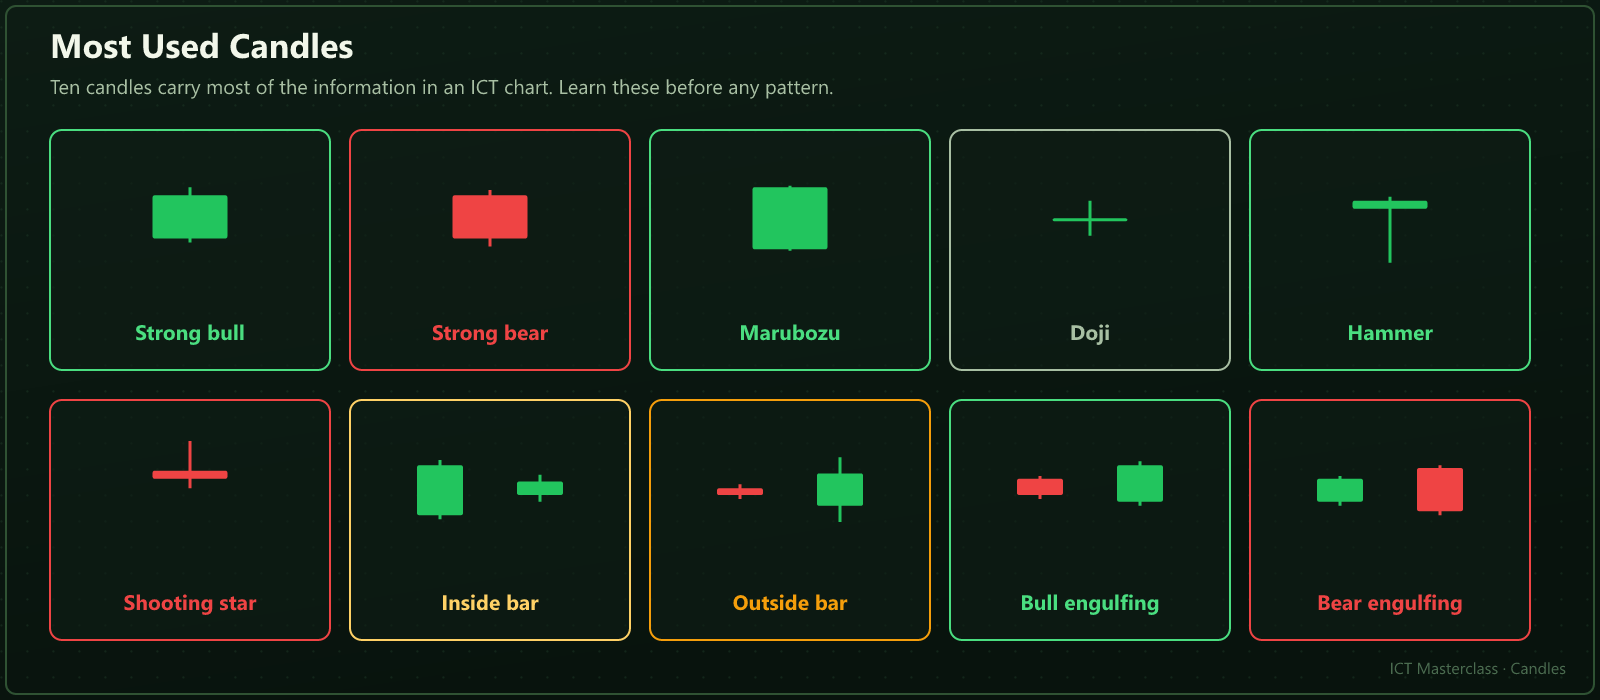
| Candle | Meaning | Where it helps |
|---|---|---|
Strong bull body | Buyers took control | Long entry in discount |
Strong bear body | Supply is active | Short entry in premium |
Marubozu | No wicks, one-sided | Creates displacement and an FVG |
Doji | Nobody won | Wait at a range edge |
Hammer | Lower wick rejection | After an equal-low sweep |
Shooting star | Upper wick rejection | Short confirmation in premium |
Inside bar | Compression | Wait before the break |
Outside bar | Both sides swept | Absorption at an OB |
Bullish engulfing | Engulfs the prior red | Signals the retrace is over |
Bearish engulfing | Engulfs the prior green | Premium rejection |
16.2Candlestick Patterns
A pattern is the story of two or three candles. Classic books label them bullish or bearish, but ICT asks one question: where did it form?
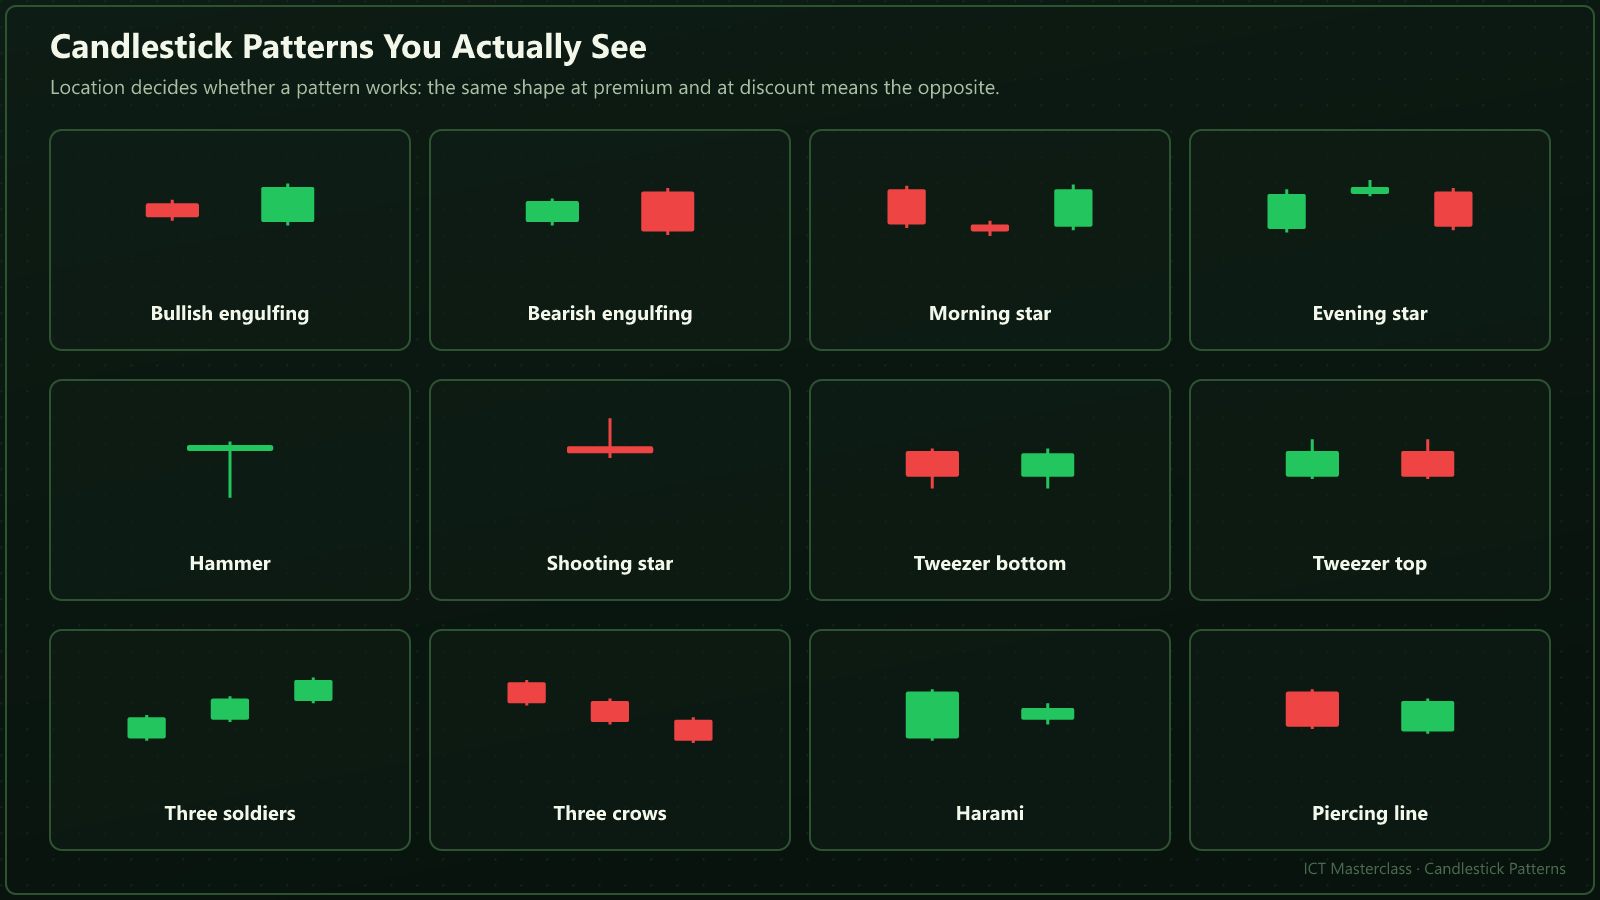
| Pattern | Strength | Caution |
|---|---|---|
Bullish engulfing | Strong | Discount only |
Bearish engulfing | Strong | Premium only |
Morning star | Very strong | Best inside OTE |
Evening star | Very strong | Best at an OB |
Hammer | Medium | After a sweep |
Shooting star | Medium | At equal highs |
Tweezer bottom | Medium | At an OB |
Tweezer top | Medium | At an FVG |
Three soldiers | Climax | Fade into HTF supply |
Three crows | Climax | Long into HTF demand |
Harami | Weak | Confluence only |
Piercing line | Medium | In discount |
16.320 Trading Patterns — Candle Basis
Every card is a complete setup: what to look for, which side to trade, and the rule in one line - all built from one or two candles.
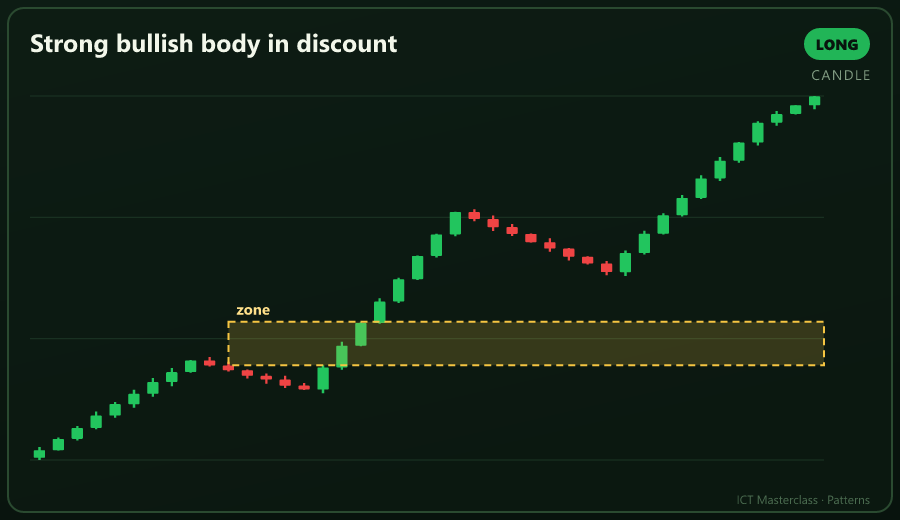
A1 Strong bullish body in discount
A large green body in the lower half means buyers took control; buy the retrace.
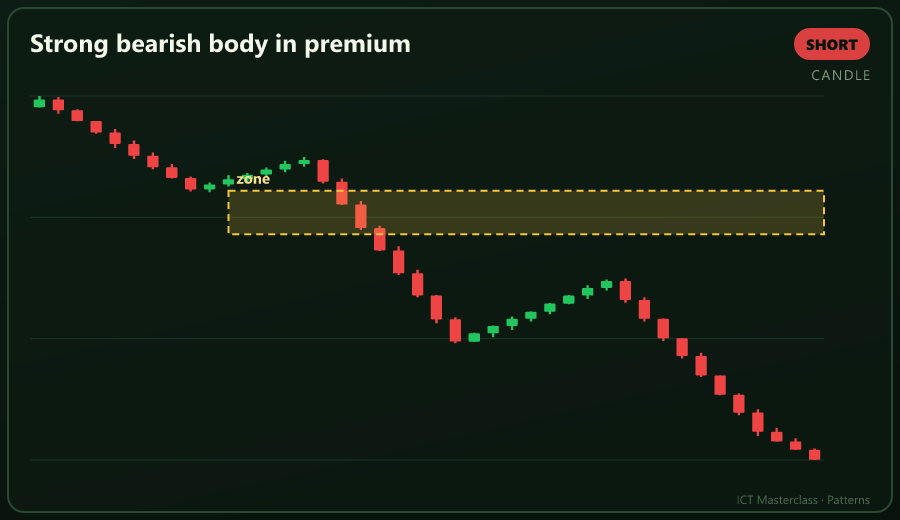
A2 Strong bearish body in premium
A large red body in premium means supply is active; short the retrace.
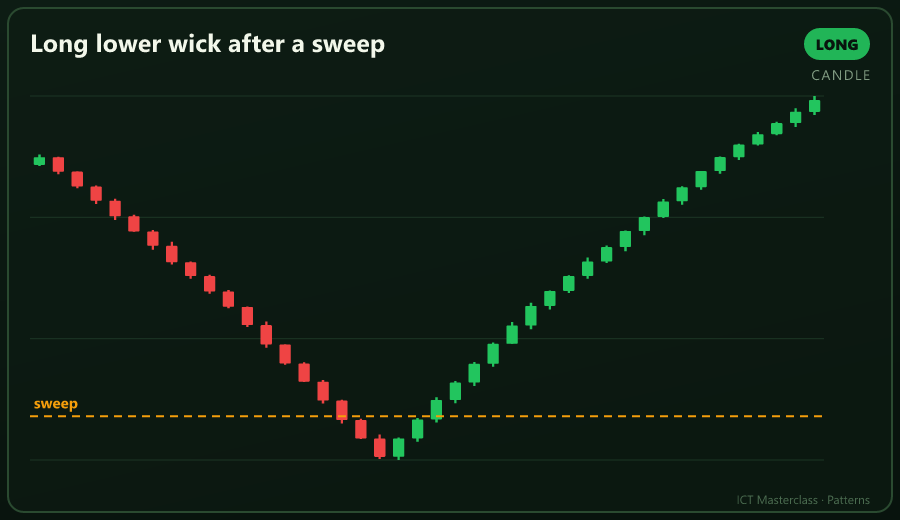
A3 Long lower wick after a sweep
The lower wick took stops and returned; long on the next MSS.
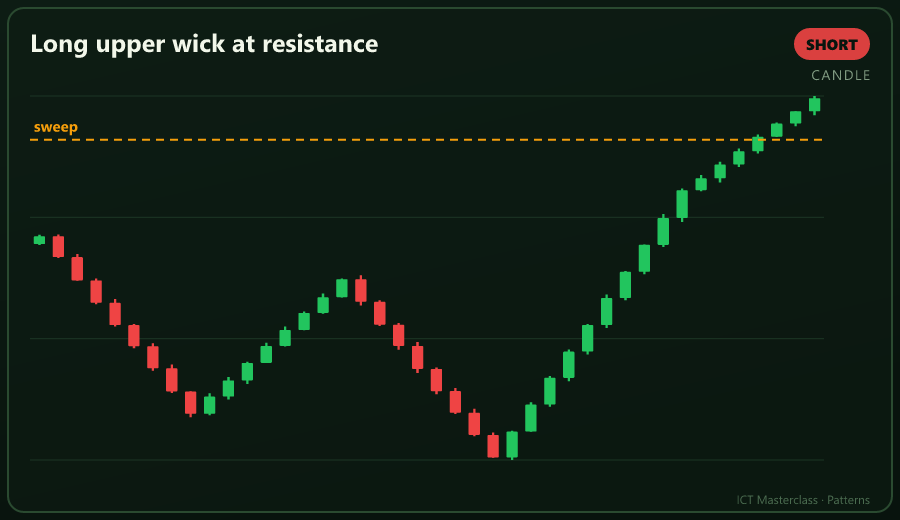
A4 Long upper wick at resistance
The upper wick is rejection; short once the body returns.
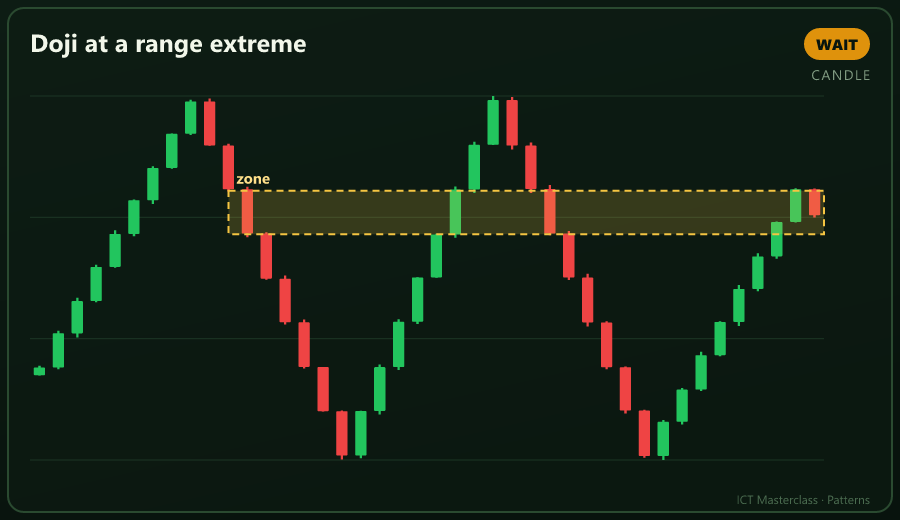
A5 Doji at a range extreme
A doji is not a decision; wait for the next close.
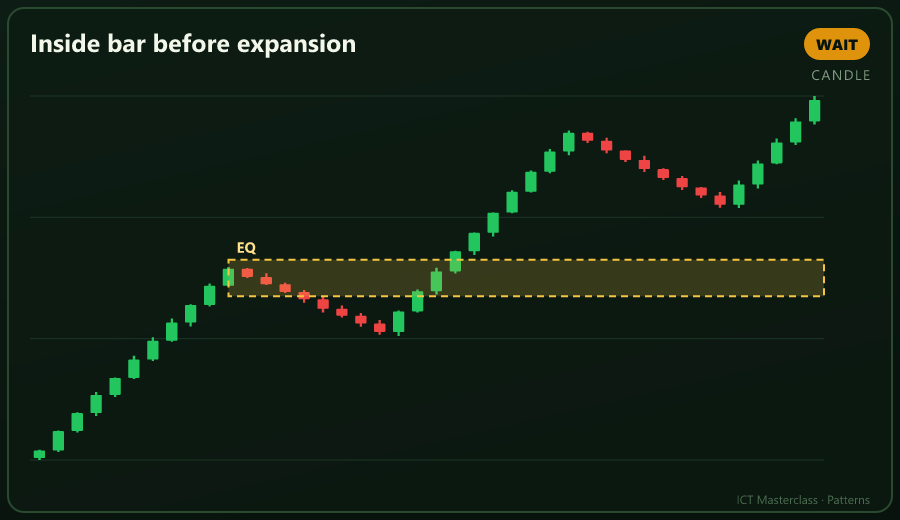
A6 Inside bar before expansion
Compression stores energy; trade the side that breaks.
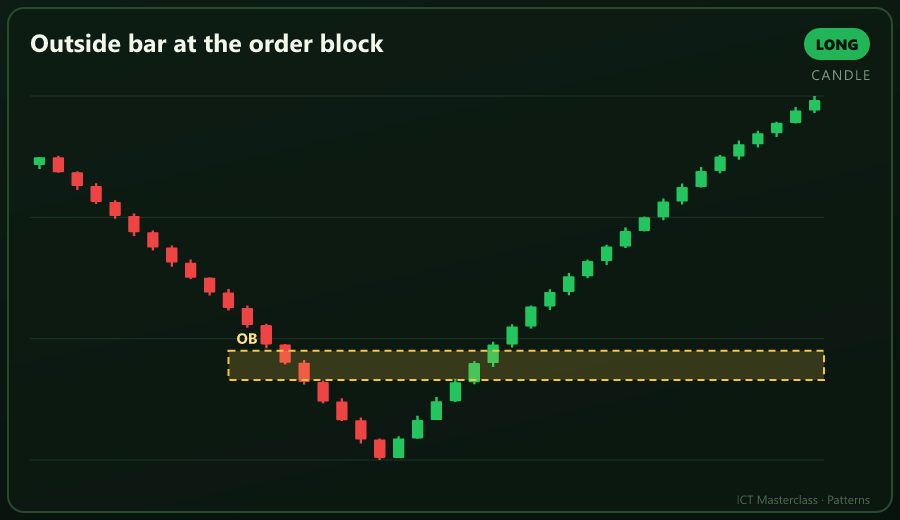
A7 Outside bar at the order block
An outside bar off the OB is absorption; your entry is in the right place.
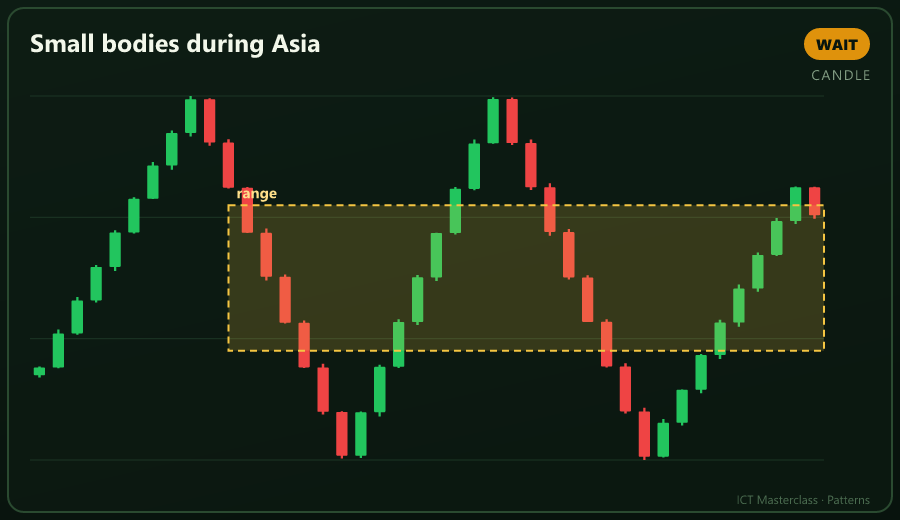
A8 Small bodies during Asia
Asia builds a range, not a direction; mark the high and low only.
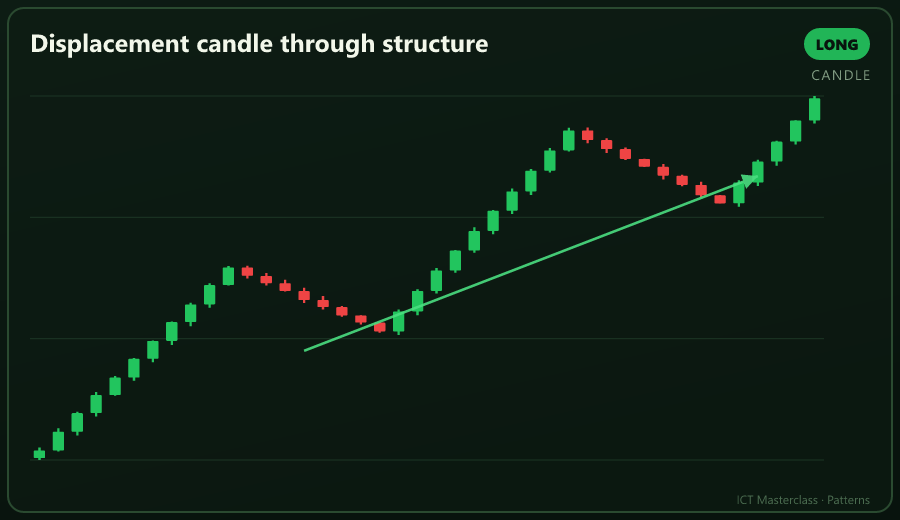
A9 Displacement candle through structure
A body close through structure is the BOS; enter at the gap it leaves.
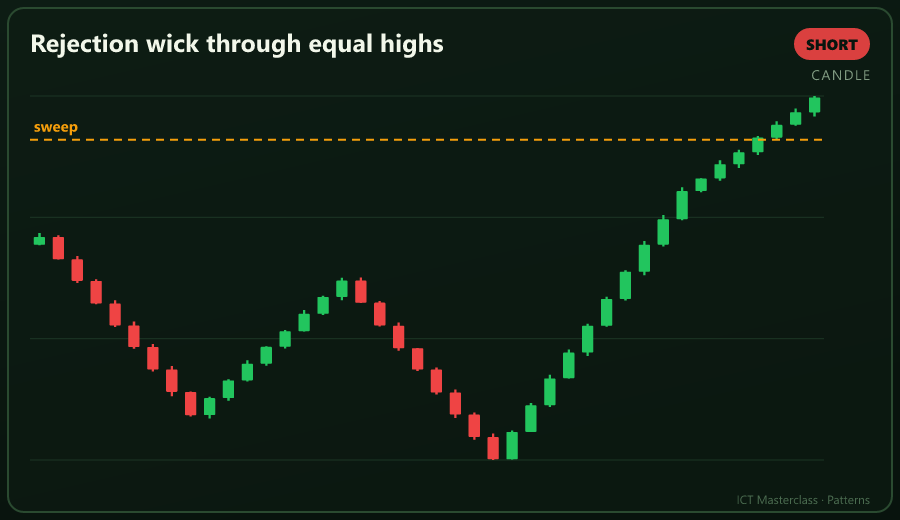
A10 Rejection wick through equal highs
A wick above that returns is a sweep, not a breakout.
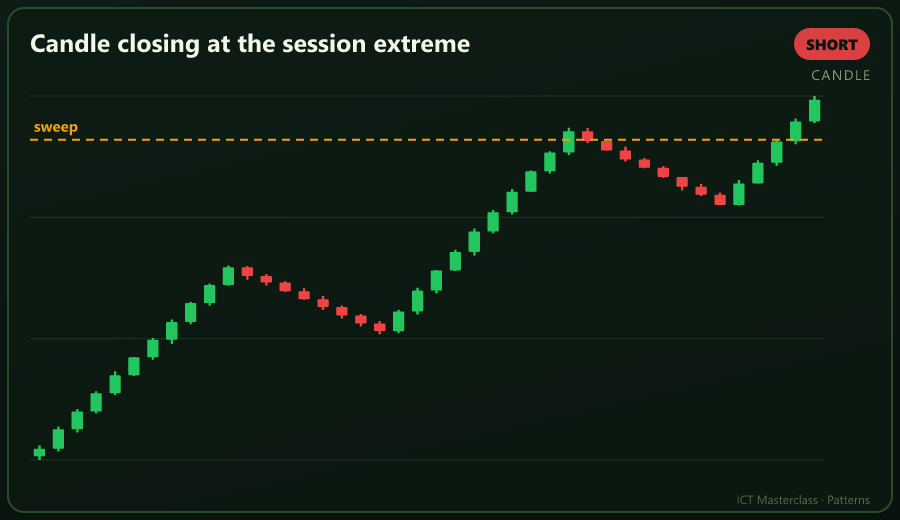
A11 Candle closing at the session extreme
Closing at the extreme means the next session likely retraces.
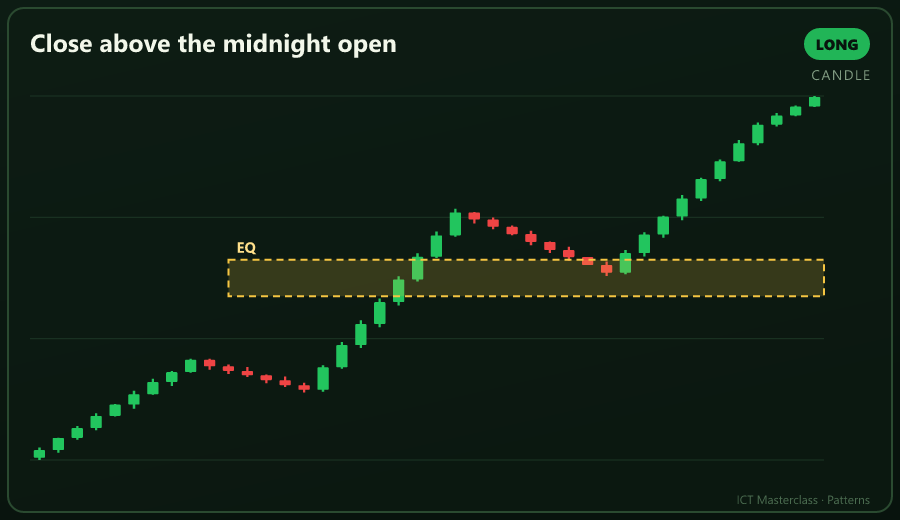
A12 Close above the midnight open
The day is premium; look for longs in discount.
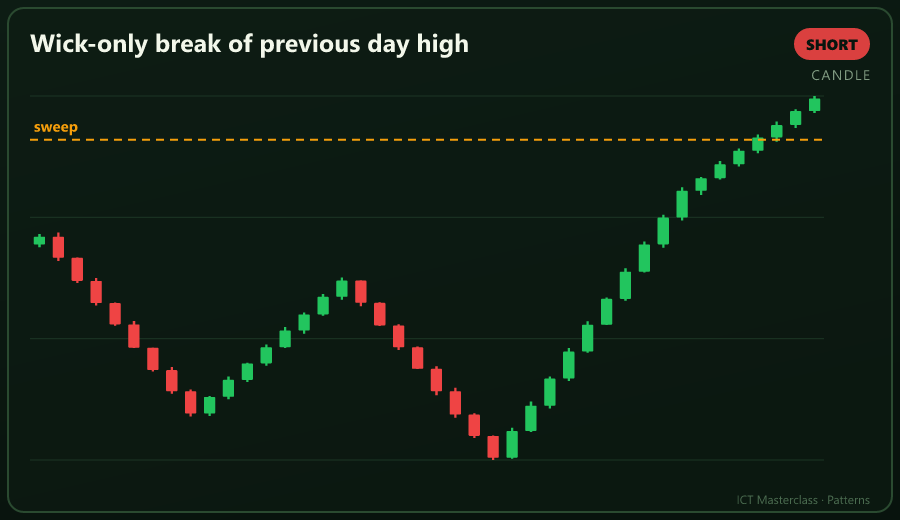
A13 Wick-only break of previous day high
A wick break takes the PDH stops; trade the other way.
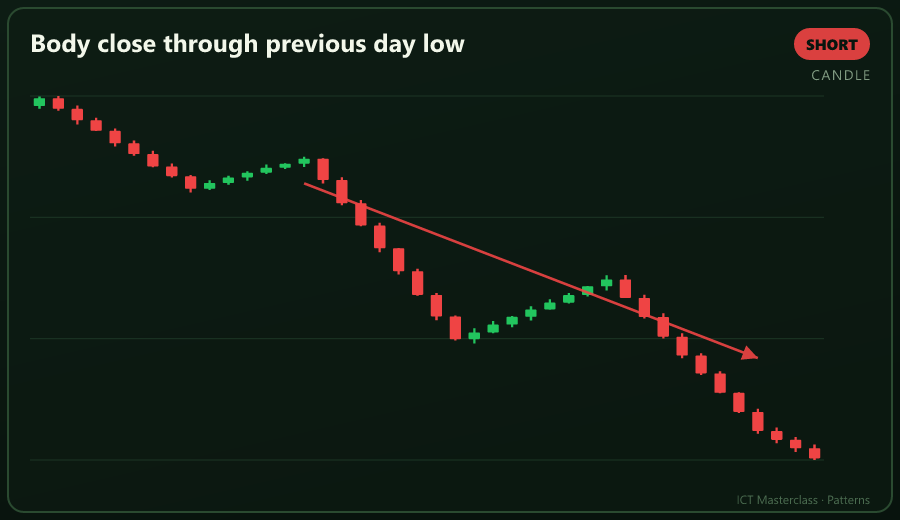
A14 Body close through previous day low
A body close is a real break; short the retrace.
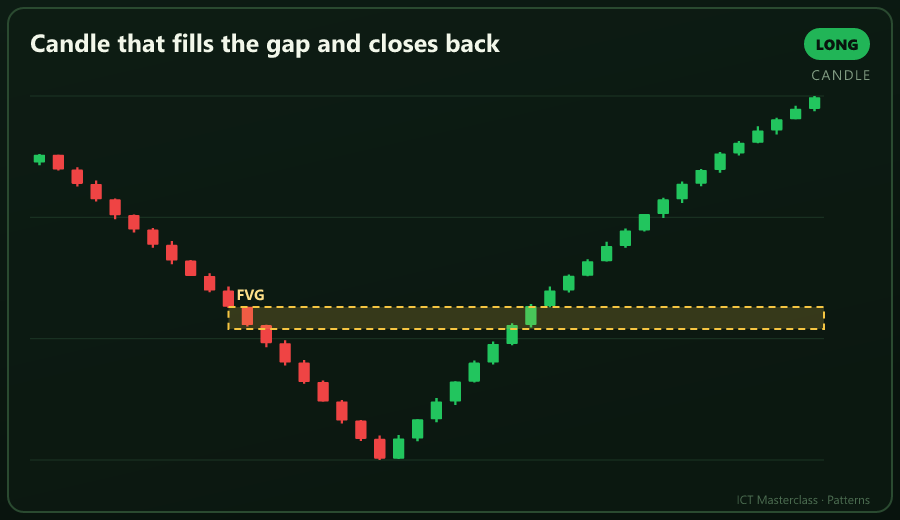
A15 Candle that fills the gap and closes back
Filling the gap with a lower wick and returning is a value grab.
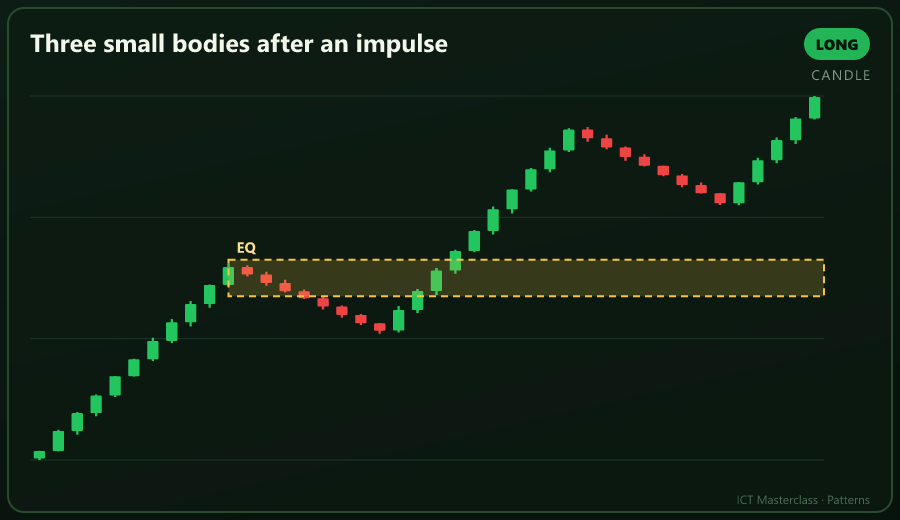
A16 Three small bodies after an impulse
A flag is a rest; continue with the trend.
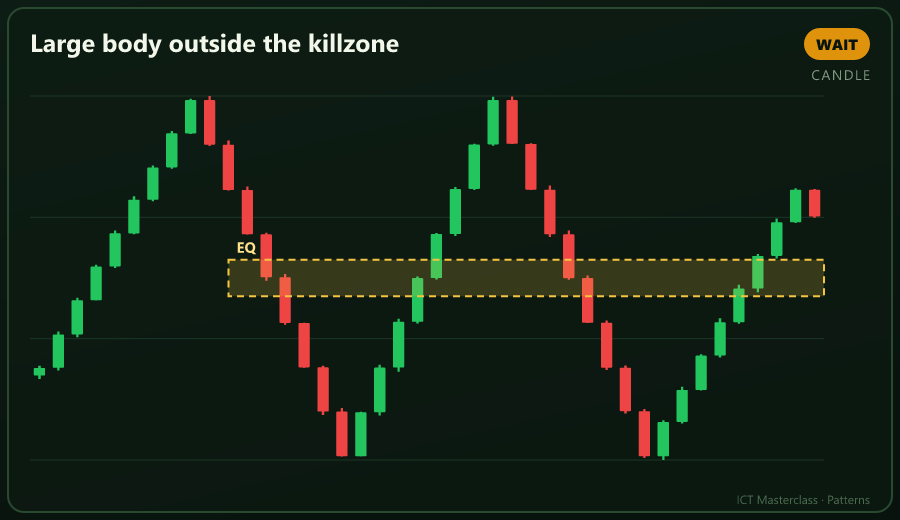
A17 Large body outside the killzone
Wrong hour makes body size meaningless.
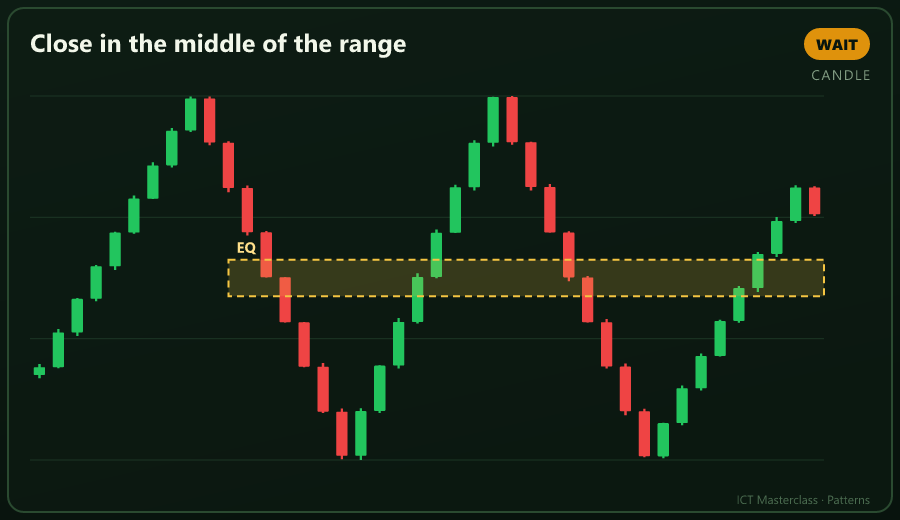
A18 Close in the middle of the range
Closing at EQ means nobody won; wait.
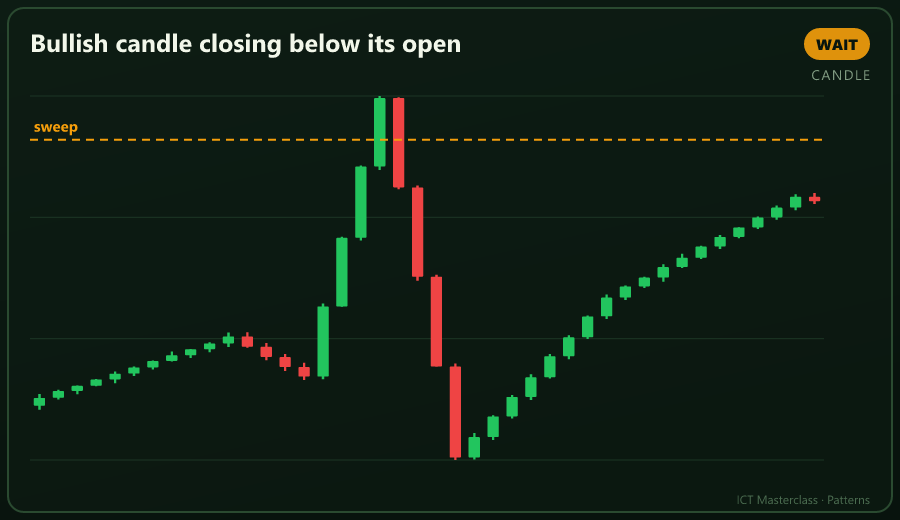
A19 Bullish candle closing below its open
An upper wick with a red body is weakness.
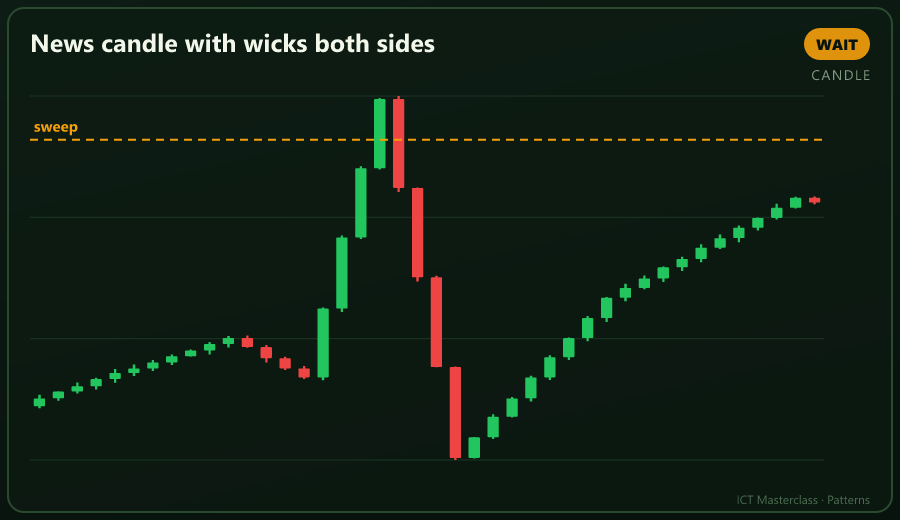
A20 News candle with wicks both sides
Wicks both sides mean clearing, not information; watch the next candle.
16.420 Trading Patterns — Candlestick Pattern Basis
Here the pattern is a combination of two or three candles - engulfing, stars, soldiers, tweezers - and where each one actually works.
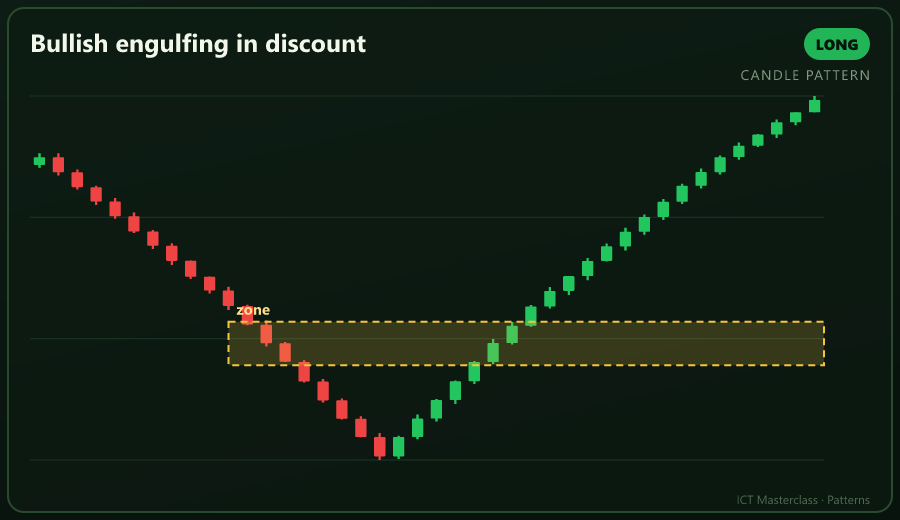
B1 Bullish engulfing in discount
A green body engulfing the prior red means buyers returned.
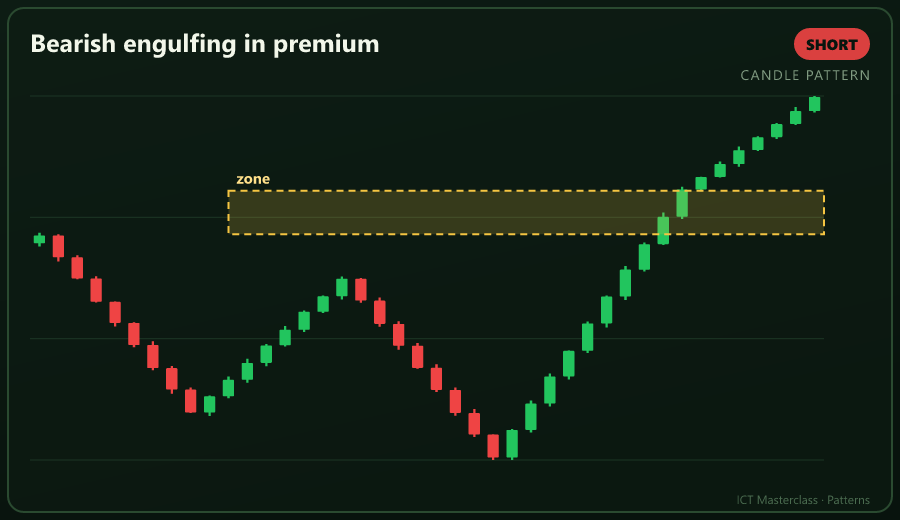
B2 Bearish engulfing in premium
A red body engulfing green in premium means supply won.
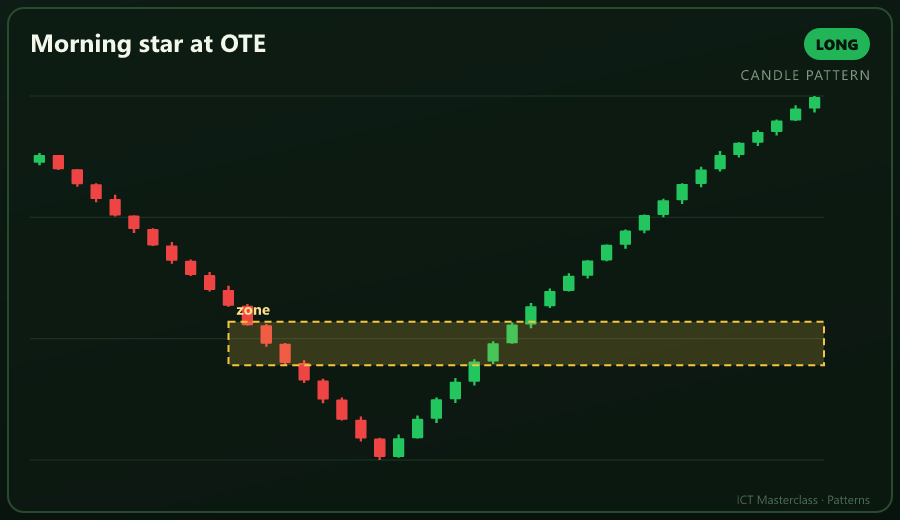
B3 Morning star at OTE
A three-candle reversal inside OTE is an A+ setup.
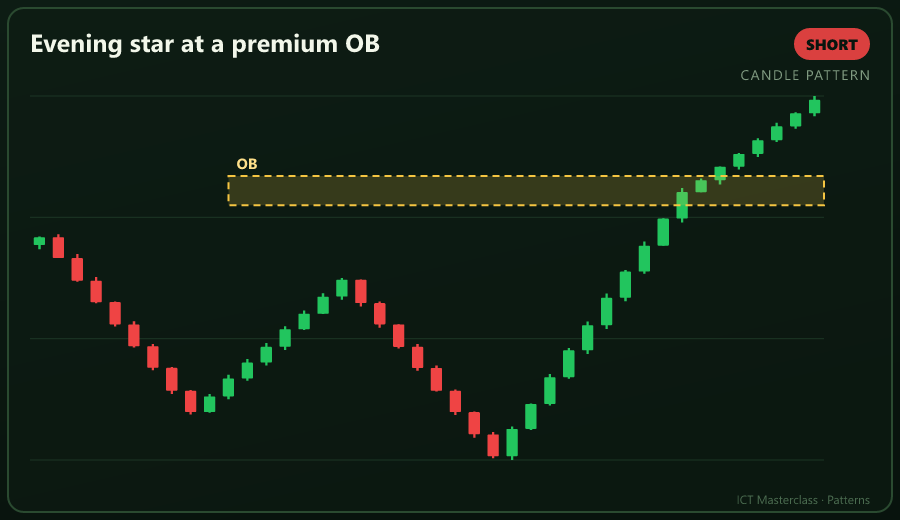
B4 Evening star at a premium OB
Failing at the OB weakens that OB.
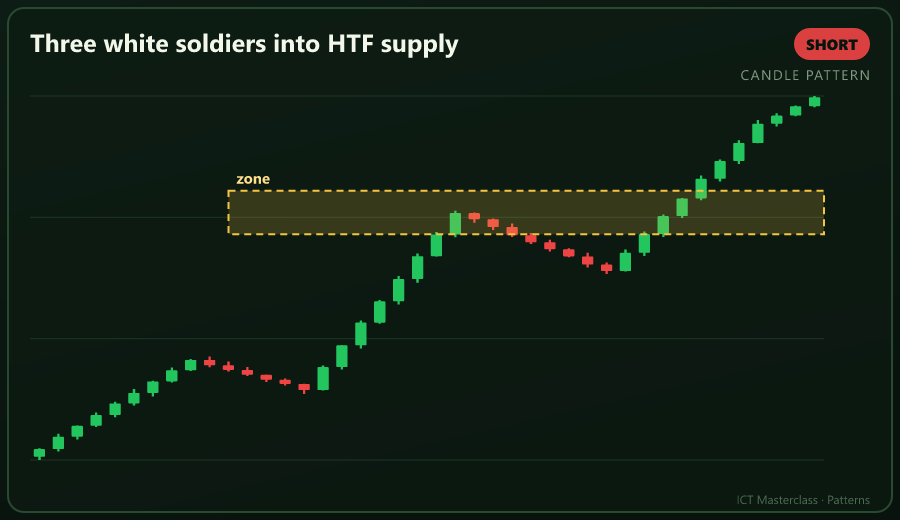
B5 Three white soldiers into HTF supply
Three greens is a climax; fade at the HTF array.
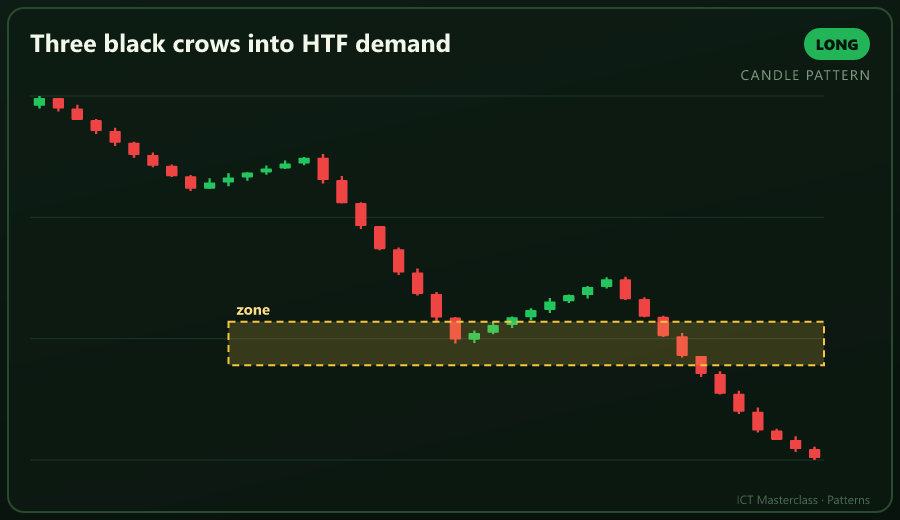
B6 Three black crows into HTF demand
A climactic drop; look for a reversal at demand.
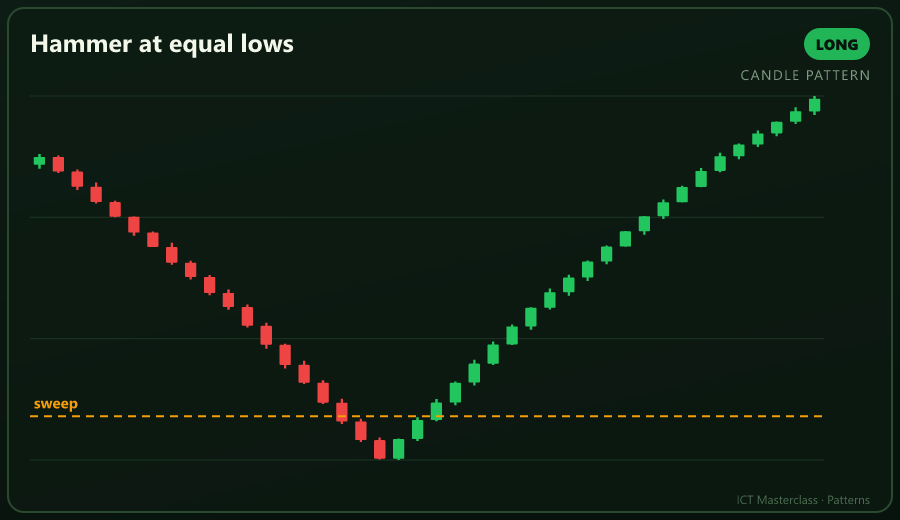
B7 Hammer at equal lows
A deep lower wick at equal lows means the stops are gone.
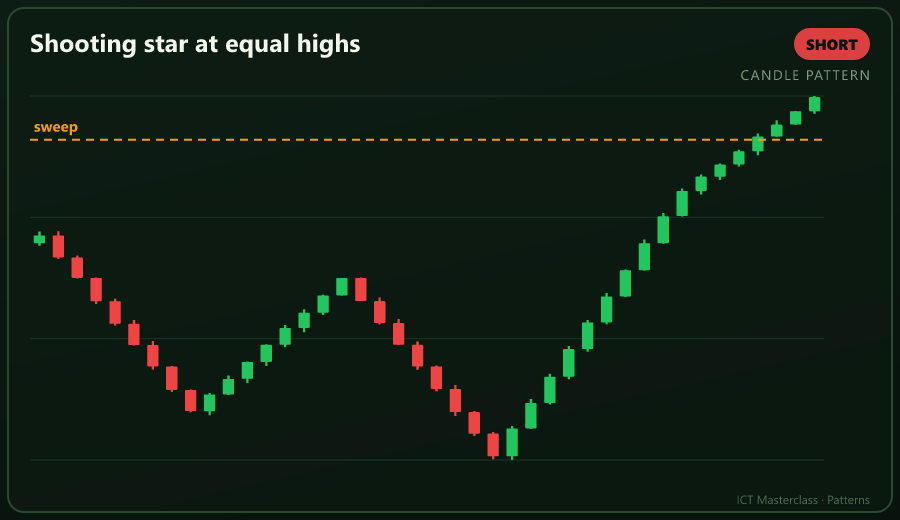
B8 Shooting star at equal highs
A long upper wick means the buy stops are taken.
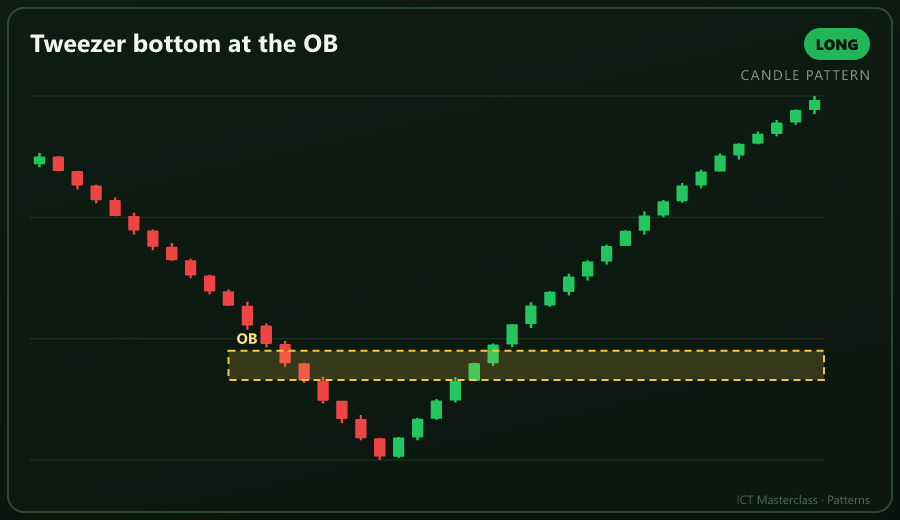
B9 Tweezer bottom at the OB
Two candles with one low means buyers defend that price.
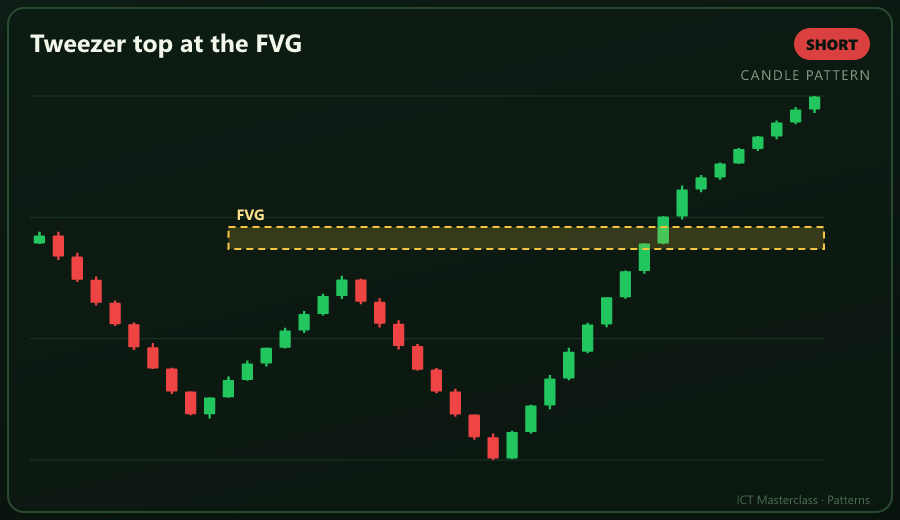
B10 Tweezer top at the FVG
The same high twice means sellers sit at that price.
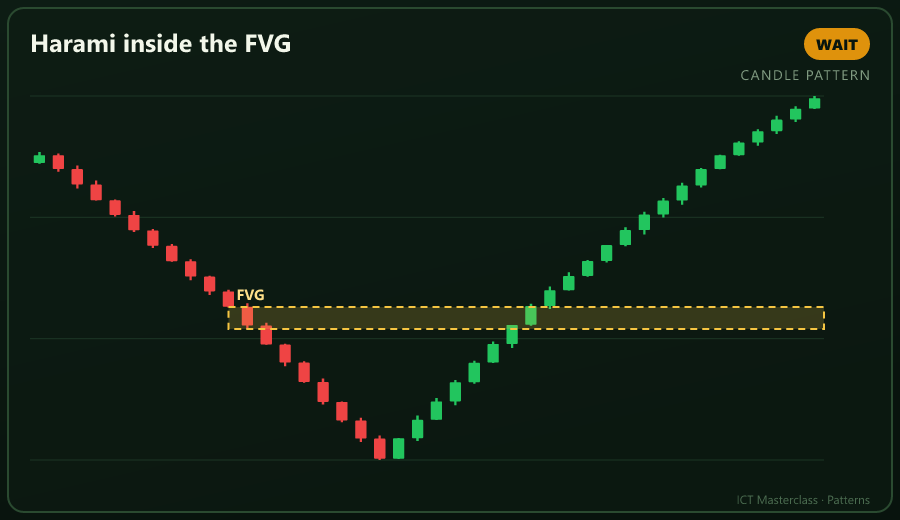
B11 Harami inside the FVG
Compression means wait; trade the break.
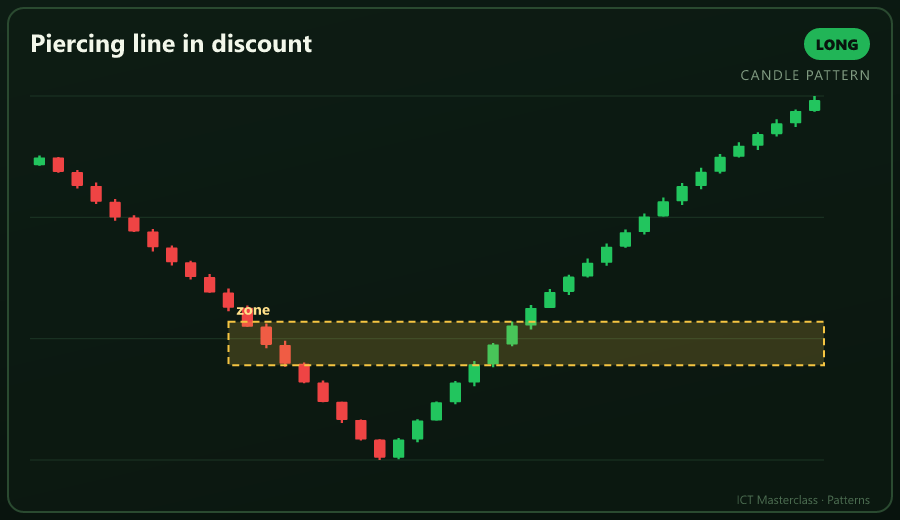
B12 Piercing line in discount
Recovering over half the red body signals strength.
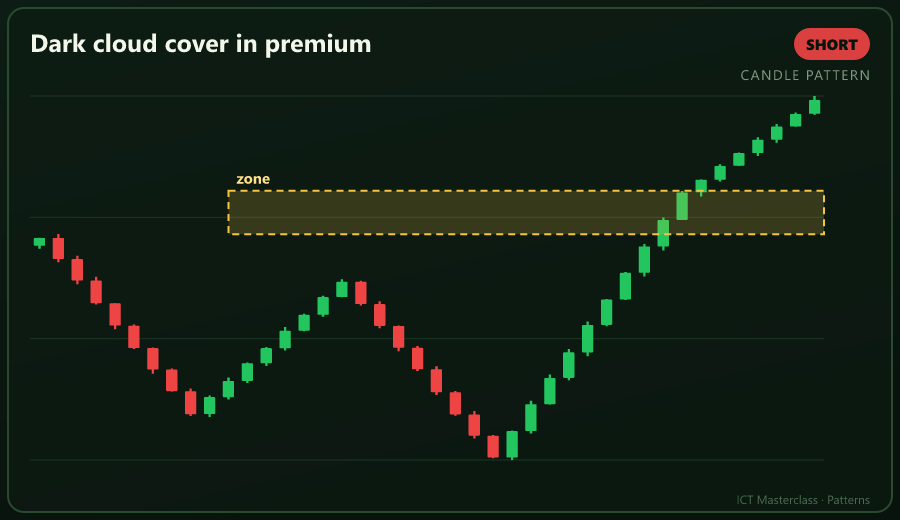
B13 Dark cloud cover in premium
Covering over half the green body with red signals weakness.
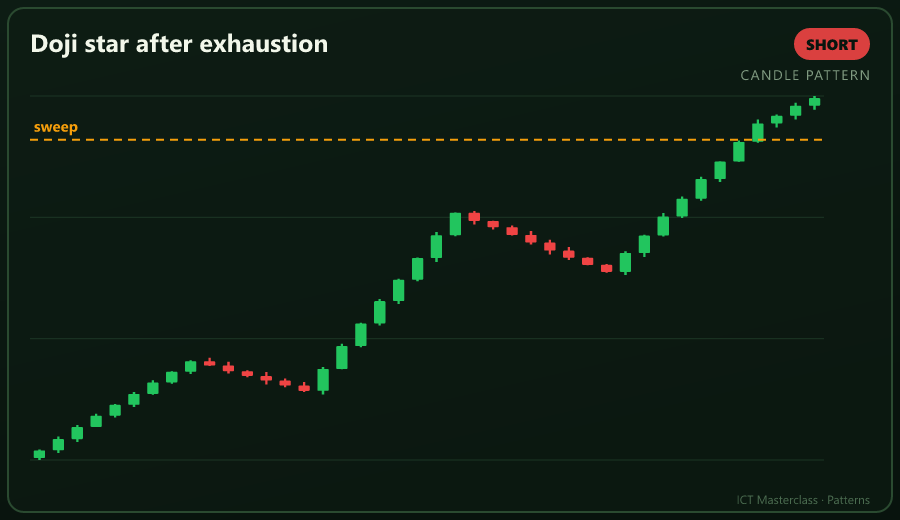
B14 Doji star after exhaustion
A doji after a big leg means the fuel is gone.
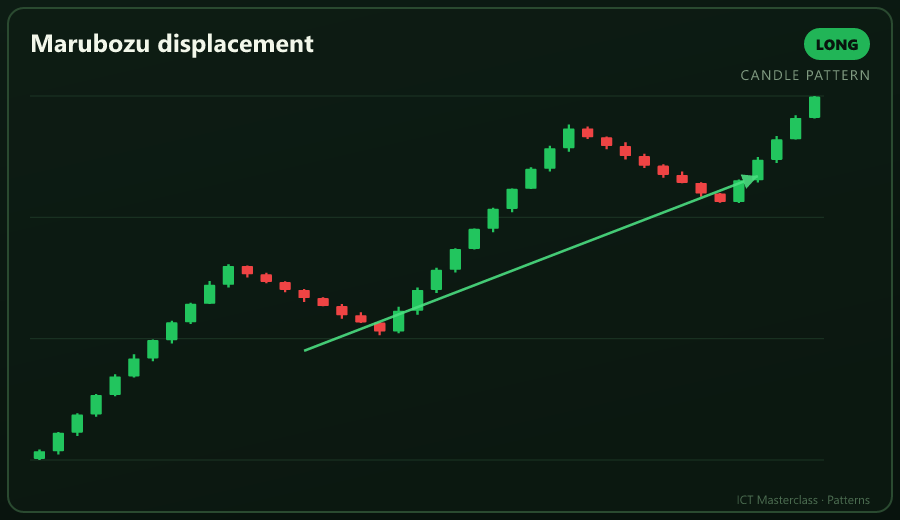
B15 Marubozu displacement
A full body leaves a gap, and that gap is the entry.
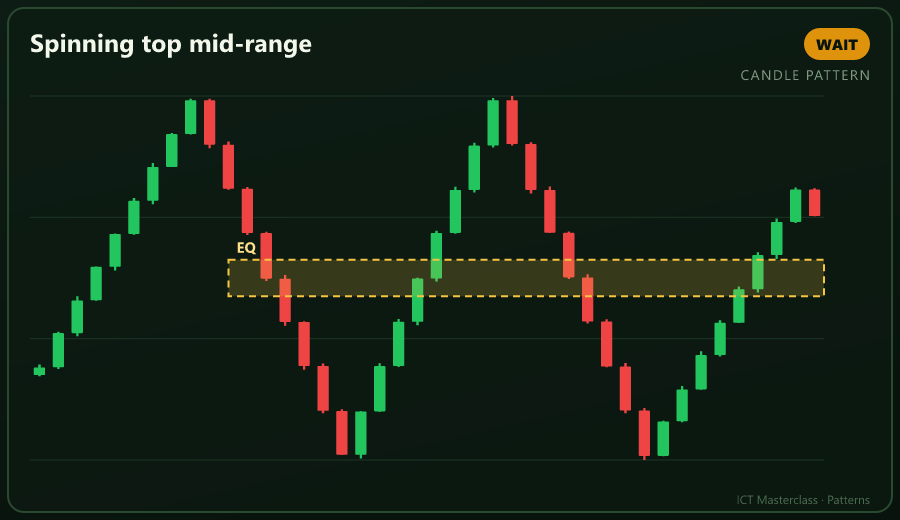
B16 Spinning top mid-range
Indecision in the middle carries no edge.
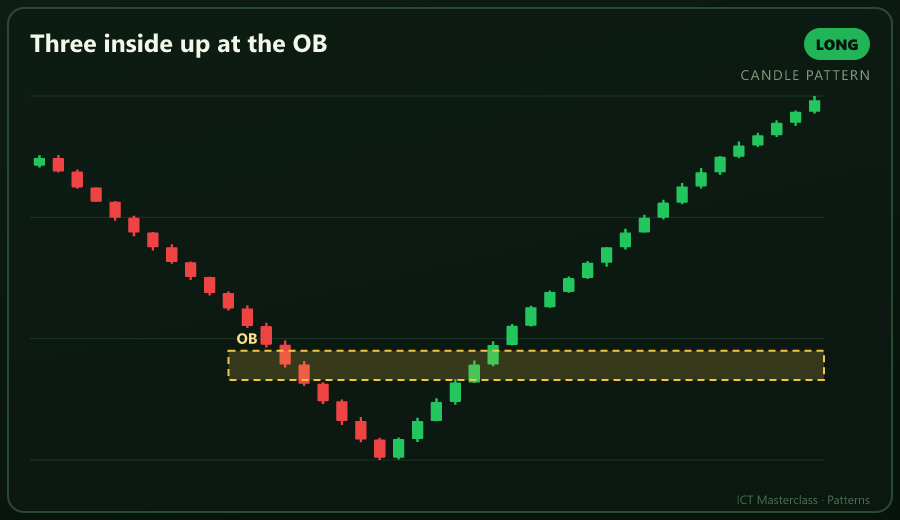
B17 Three inside up at the OB
Inside confirmation at an OB is a low-risk entry.
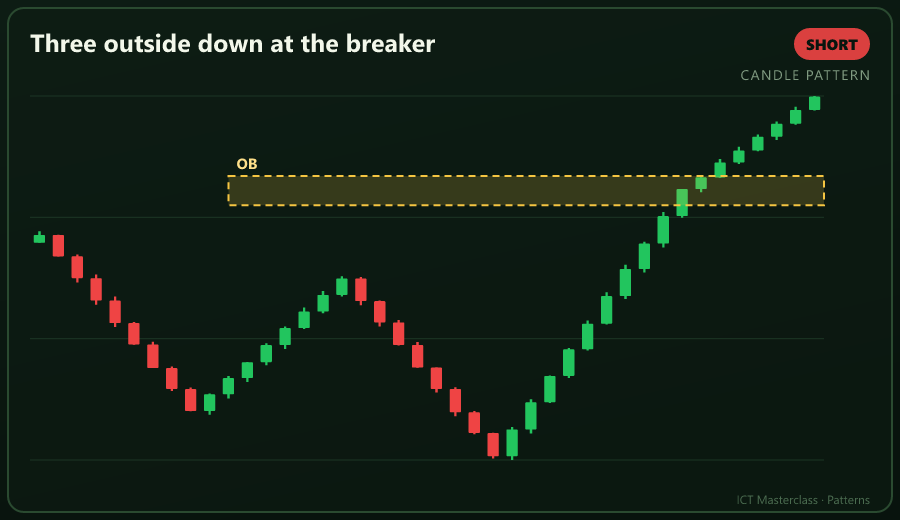
B18 Three outside down at the breaker
A strong bearish confirmation on the breaker retest.
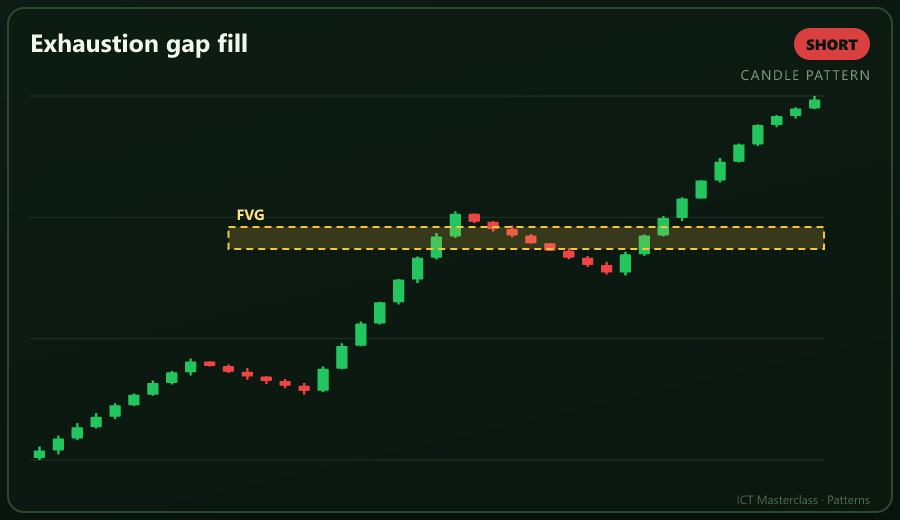
B19 Exhaustion gap fill
An exhaustion gap filling is a sign the leg is done.
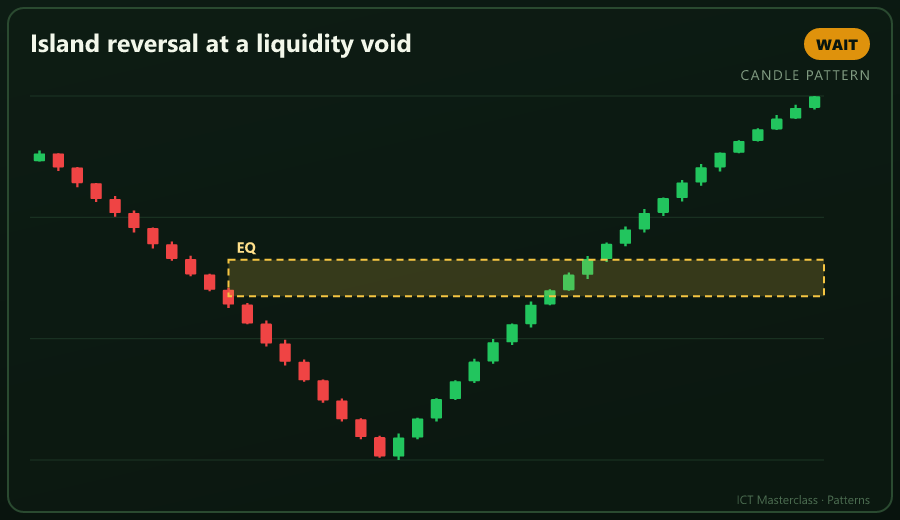
B20 Island reversal at a liquidity void
Gaps either side of a void are a strong reversal hint.
"A pattern tells you who won the candle; the zone tells you whether winning matters."
Educational material only · not financial advice.